如何搭建node_exporter
如何搭建node_exporter
1.观看条件
1.假设你已经看过上一篇文章 《如何搭建普罗米修斯 Prometheus》
2.假设你已经会搭建普罗米修斯(promethus)
3.上面两个假设,只要满足一个。那你看这篇文章就没什么压力了
2.node_exporter是啥
node_exporter的本质是一个轻量级的服务器。它监控着自己所部署的机器,并对普罗米修斯(promethus)提供HTTP接口。
当普罗米修斯定时(默认每15秒调用1次)调用它的时候,node_exporter就把当前机器的信息(内存/CPU/IO等等)源源不断的传回promethus。
PS1: 所以,每台要被监控的机器,都需要部署一个node_exporter。但是promethus可以只部署1个
PS2: 部署promethus机器的IP到部署node_exporter的IP和端口的防火墙要打通
PS3: 因为我这边只是在本机演示,所以不需要开防火墙
3.node_exporter如何搭建
进入下载页面
https://github.com/prometheus/node_exporter/releases
往下拉找到如下图所示
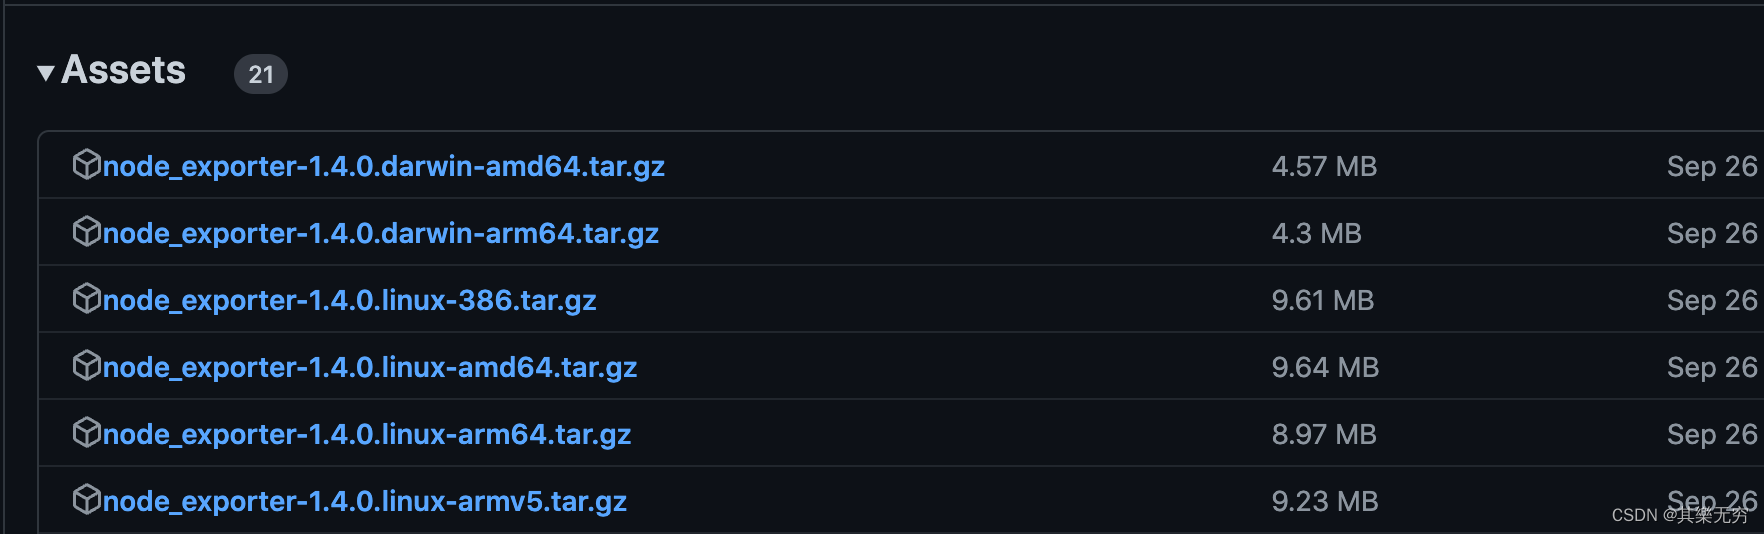
下载其中的一个文件
不同的系统下载不同的文件就可以
| 如果你的系统是 | 那么你要下载的文件是 | 备注 |
|---|---|---|
| linux系统 | node_exporter-1.4.0.linux-amd64.tar.gz | 版本号可以是1.4.0的,也可以是其他的 |
| mac系统 | node_exporter-1.4.0.darwin-amd64.tar.gz | 版本号可以是1.4.0的,也可以是其他的 |
PS: 因为我是mac,所以我就下载node_exporter-1.4.0.darwin-amd64.tar.gz了。
4.解压node_exporter
tar zxvf node_exporter-1.4.0.darwin-amd64.tar.gz
| 命令介绍 | 含义 |
|---|---|
| tar | 解压命令 |
| z | 当要解压gz文件时需要携带该参数 |
| x | 表示解包(如果去掉,只会显示而不解压) |
| v | Verbose(冗长的; 啰唆的; 唠叨的;)表示解压时会打印详细信息 |
| f | File 表示对文件进行解压 |
| node_exporter-1.4.0.darwin-amd64.tar.gz | 被解压的文件名 |
5.进入解压后的目录
cd node_exporter-1.4.0.darwin-amd64
ls
LICENSE NOTICE node_exporter
前期使用时比较重要的文件介绍
| 文件 | 文件作用 |
|---|---|
| node_exporter | 可执行文件,用于启动node_exporter |
6.启动
前台启动
./node_exporter
前台启动,很容易就会关闭,建议后台启动
nohup ./node_exporter &
至此node_exporter已经搭建完毕
node_exporter如果不指定,默认会暴露9100端口
7.查看效果
无论你是前台启动,还是后台启动。
打开网页
http://localhost:9100/metrics
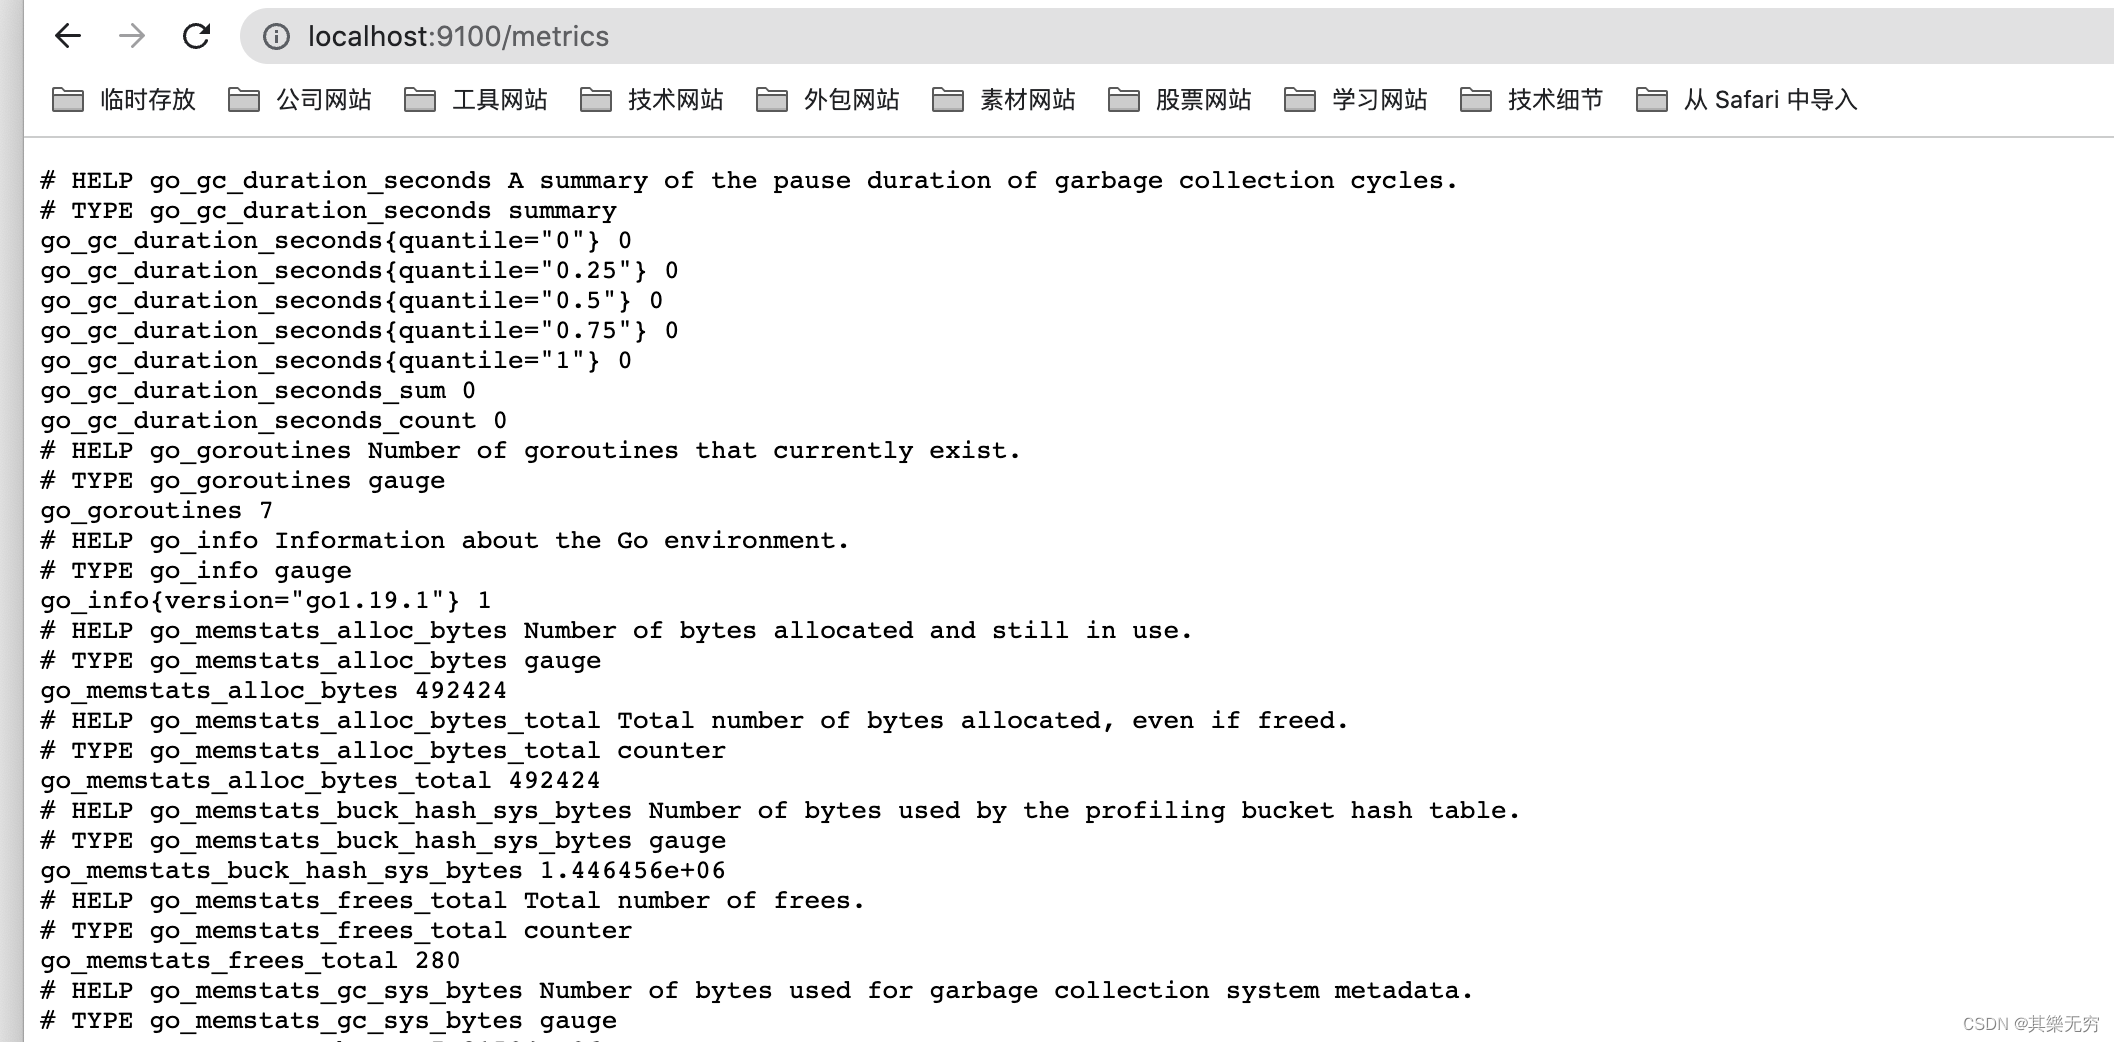
可以看到node_exporter监控得到的各种信息
8.promethus与node_exporter交互
至此node_exporter搭建好了,但是这还不够。我们不能让node_exporter自己玩。还需要让promethus可以知道该节点的存在。
因此还需要配置promethus的配置文件
首先我们要进入promethus的目录(不知道目录在哪里的,可以参考上一篇博客 《如何搭建普罗米修斯 Prometheus》)
修改prometheus.yml的配置。
vi prometheus.yml
这是原来的配置
# my global config
global:scrape_interval: 15s # Set the scrape interval to every 15 seconds. Default is every 1 minute.evaluation_interval: 15s # Evaluate rules every 15 seconds. The default is every 1 minute.# scrape_timeout is set to the global default (10s).# Alertmanager configuration
alerting:alertmanagers:- static_configs:- targets:# - alertmanager:9093# Load rules once and periodically evaluate them according to the global 'evaluation_interval'.
rule_files:# - "first_rules.yml"# - "second_rules.yml"# A scrape configuration containing exactly one endpoint to scrape:
# Here it's Prometheus itself.
scrape_configs:# The job name is added as a label `job=` to any timeseries scraped from this config.- job_name: "prometheus"# metrics_path defaults to '/metrics'# scheme defaults to 'http'.static_configs:- targets: ["localhost:9090"]
由于里面有很多#表示注释,看着比较乱。简化后,大概如下所示:
global:scrape_interval: 15s evaluation_interval: 15s alerting:alertmanagers:- static_configs:- targets:# - alertmanager:9093rule_files:# - "first_rules.yml"# - "second_rules.yml"scrape_configs:- job_name: "prometheus"static_configs:- targets: ["localhost:9090"]
可以在末尾追加新的配置
- job_name: "my_node_1"static_configs:- targets: ["localhost:9100"]
| 参数 | 含义及作用 |
|---|---|
| job_name | 监控任务名称,可以是中文 |
| targets | 被监控的目标。为啥填localhost:9100。因为我们的node_exporter默认启动在9100端口。 |
最终完整的prometheus.yml配置如下:
global:scrape_interval: 15s evaluation_interval: 15s alerting:alertmanagers:- static_configs:- targets:# - alertmanager:9093rule_files:# - "first_rules.yml"# - "second_rules.yml"scrape_configs:- job_name: "prometheus"static_configs:- targets: ["localhost:9090"]- job_name: "my_node_1"static_configs:- targets: ["localhost:9100"]
**PS: 切记!yml文件非常注重缩进,不要随意夹断 **
7.重启promethus
ps -ef|grep prometheus
501 9571 2793 0 3:38下午 ttys000 0:00.17 ./prometheus501 10404 2793 0 3:40下午 ttys000 0:00.00 grep prometheus
kill -9 9571
后台启动prometheus
nohup ./prometheus &
8.验证是否有监控到
打开promethus页面
http://localhost:9090/graph
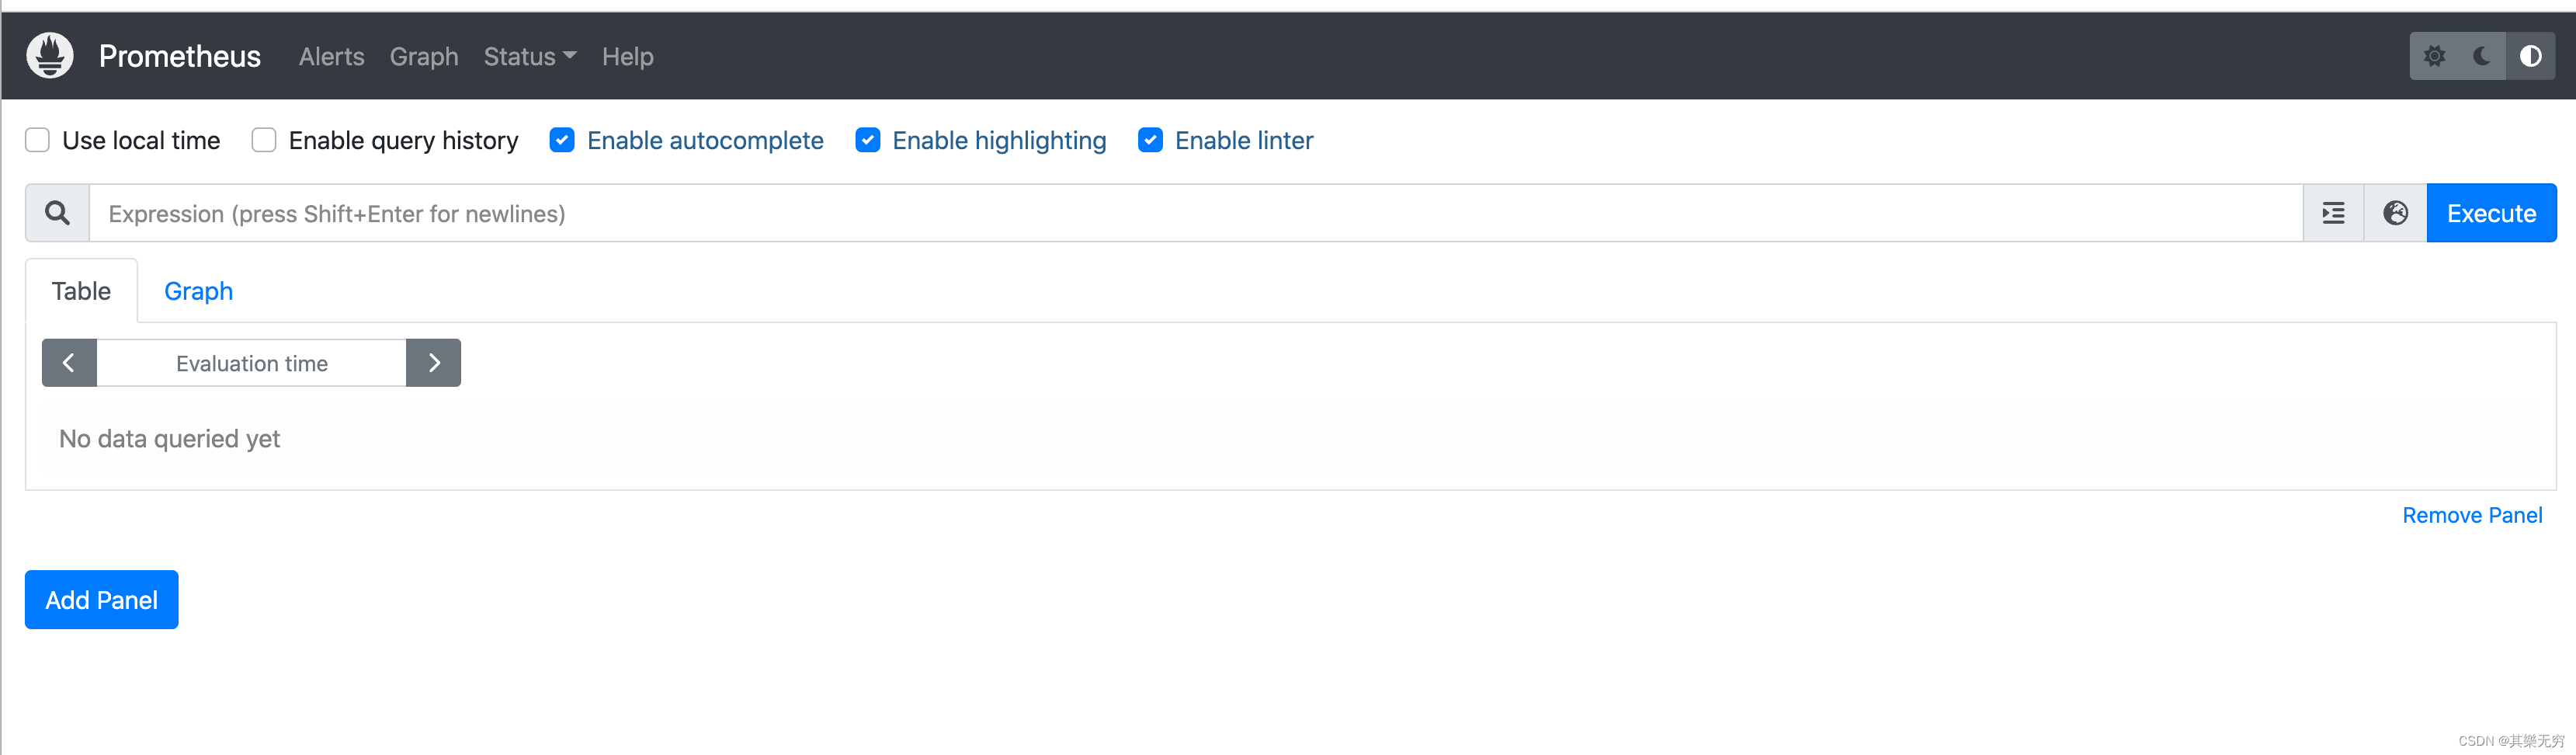
然后输入up并点击按钮执行
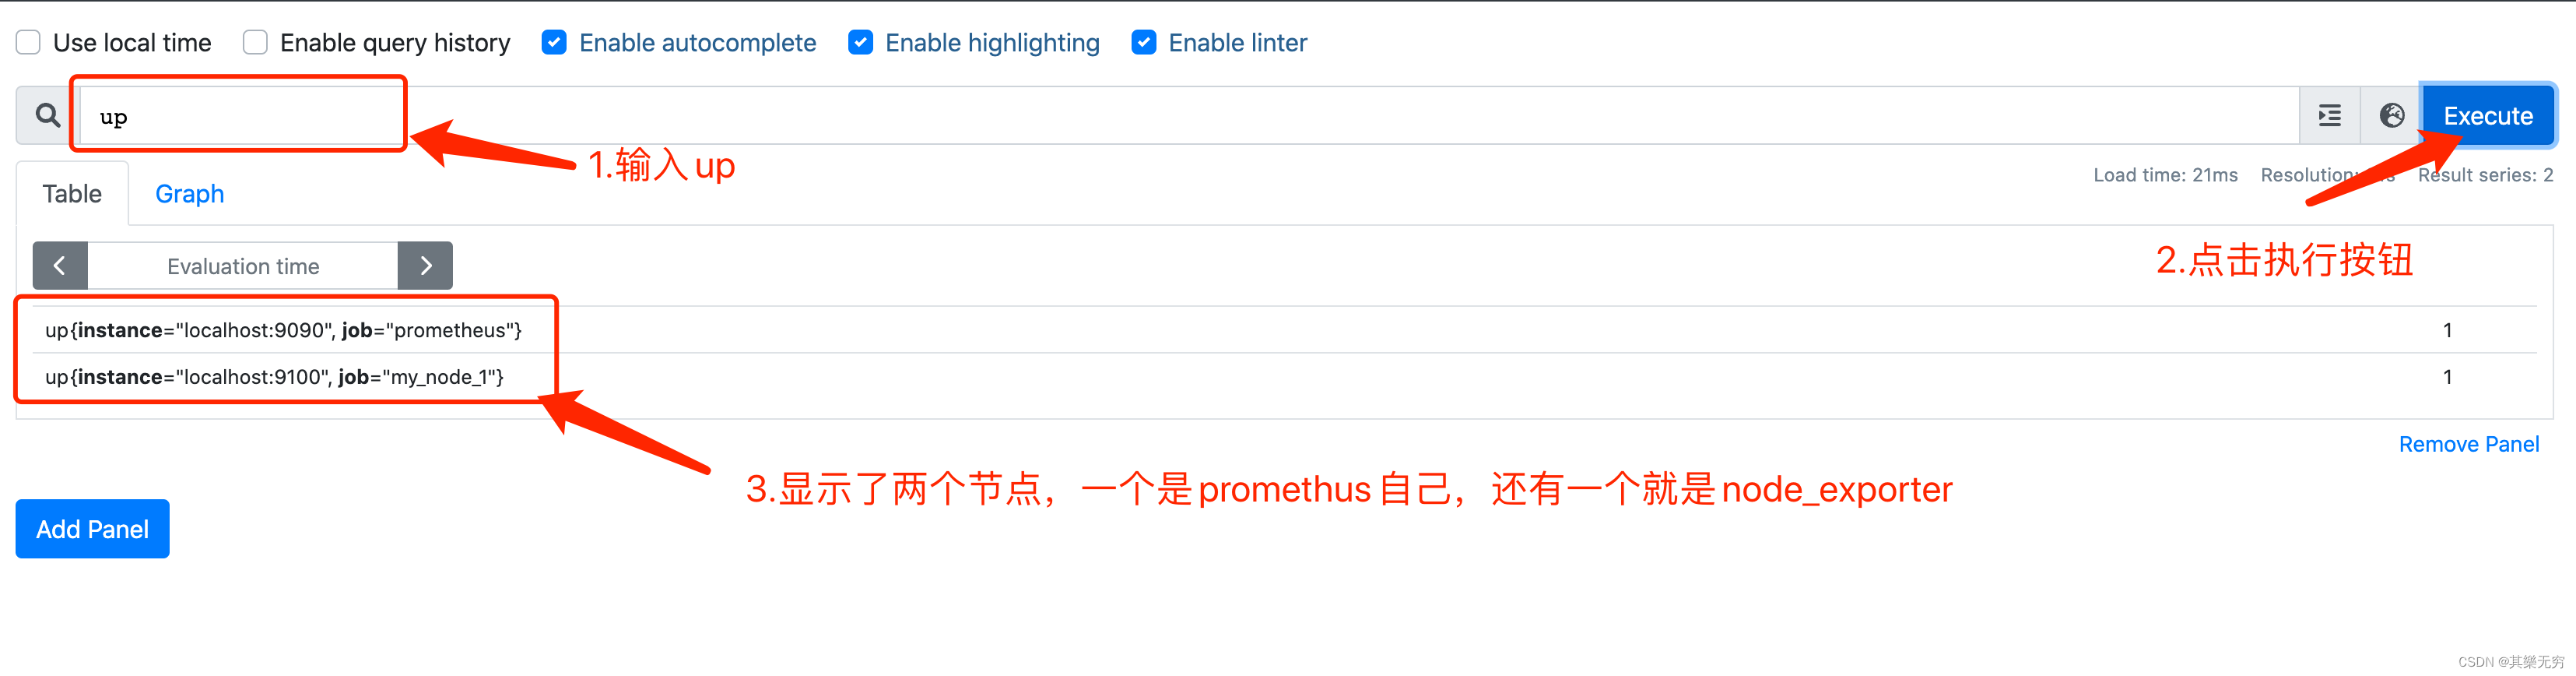
至此,promethus可以不断扫描node_exporter节点
9.小结
本章博客,我们完成了如下内容
- node_exporter的搭建
- 让node_exporter与promethus进行了联系。
但是这就完了吗?
我们其实还有很多问题没有解开。
比如:
- 这个输入框中输入up到底是什么意思?
- 这个输入框到底可以填哪些东西?
- 监控页面需要如何制作?
那么就交给之后的博客来介绍啦。